A single-sheet Excel tool that plots the payoff of any multi-leg options strategy. Enter up to four option legs plus stock and forward positions, and it draws the combined profit-and-loss curve across the full range of underlying prices at expiry.
Overview
Options strategies are hard to reason about from the leg definitions alone. The tool takes each leg, computes its payoff at expiry across a range of underlying prices, and sums them into one curve — so the shape of the strategy (the breakevens, the capped upside, the max loss) is visible at a glance.
Each call or put, long or short, with its own quantity, strike, and premium.
Layer a linear underlying or forward position on top of the options to model covered calls, collars, and hedged structures.
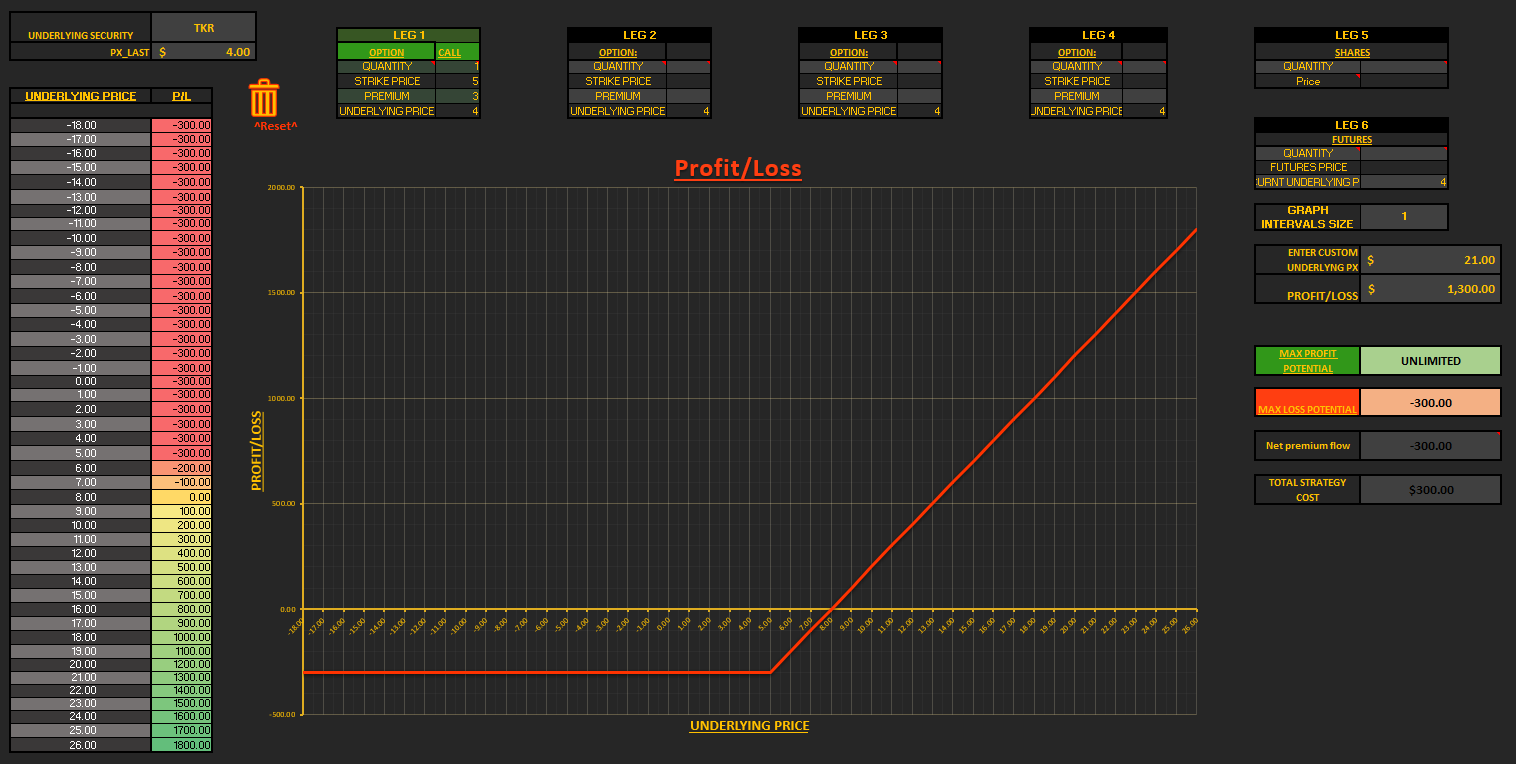
Every leg's payoff is summed and charted live against the underlying price, recentred on the current spot.
Workflow
Step 01 — Define the legs
Set the underlying ticker, then build the strategy leg by leg. For each option leg pick call or put, set quantity (positive long, negative short), strike, and premium. Stock and forward legs are entered the same way. The underlying's spot price pulls from Bloomberg and centres the payoff range.
Step 02 — Per-leg payoff
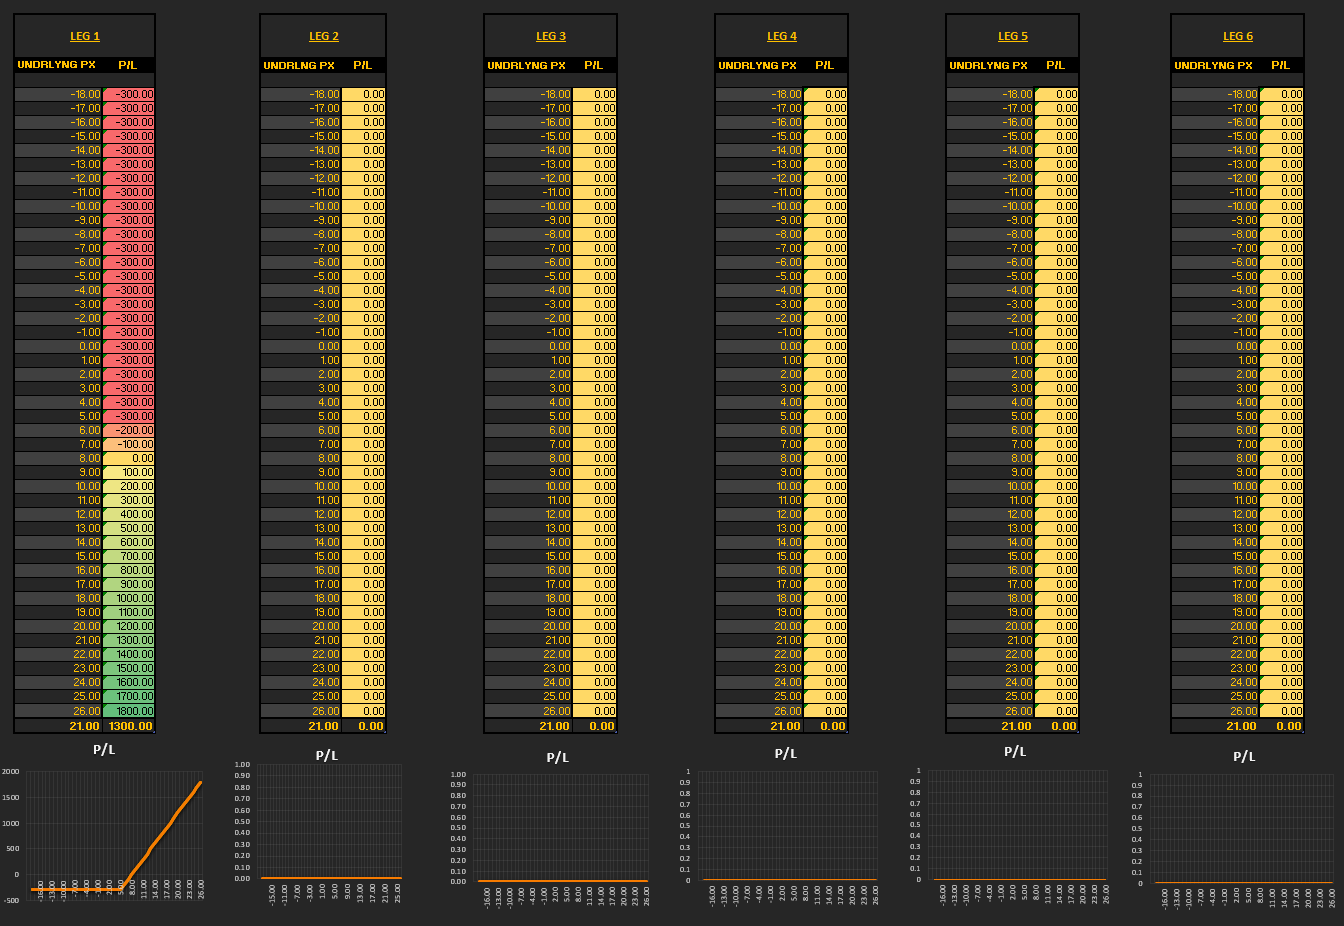
Each leg's value at expiry is computed across a grid of underlying prices centred on spot — intrinsic payoff net of premium, scaled by quantity and contract size. This is the per-leg calculation block that feeds the chart.
Step 03 — Combined payoff chart
The per-leg payoffs are summed into one P/L curve and plotted live against the underlying price. Breakevens, max profit, and max loss read straight off the chart.
Download
The macro-enabled Excel workbook. A Bloomberg Terminal is only needed to auto-pull the spot price; the underlying price can also be typed in by hand, so the tool works fully offline.
Download (.xlsm)Macro-enabled · works offline with manual spot price